Written by Sunny Yoon
Written by Sunny Yoon
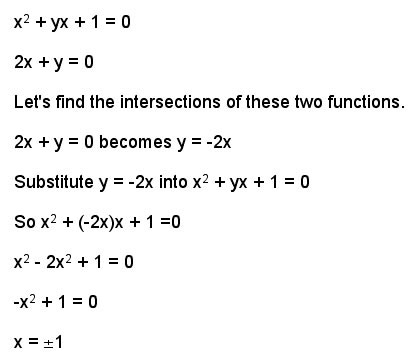
When examining this equation, ![]() using the Graphing Calculator, here's the original graph.
using the Graphing Calculator, here's the original graph.
When you graph a horizontal line, it will intersect with the original equation at either 1)two points, 2) 1 point or 3) no point. Whenever the horizontal line intersects with the original equation will be the set of solutions for the quadratic equation when you replace y with the value used for the horizontal line. For example, when y = 3, the two points of intersection will be the set of solutions when x^2 + 3x + 1 = 0.
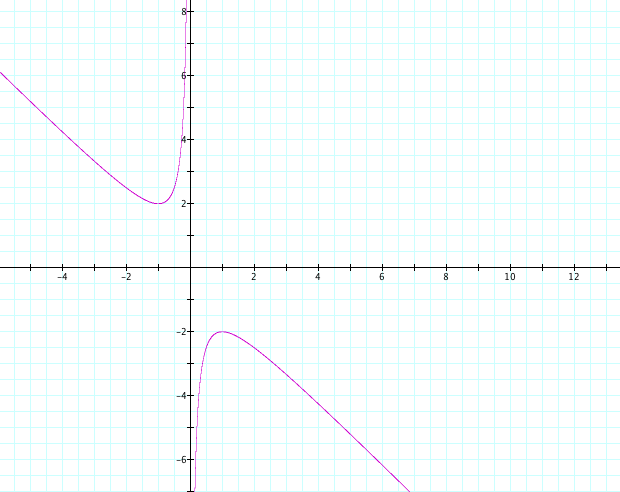
Consider the case when c = -1 instead of 1.
You should have![]() and your graph looks like
and your graph looks like
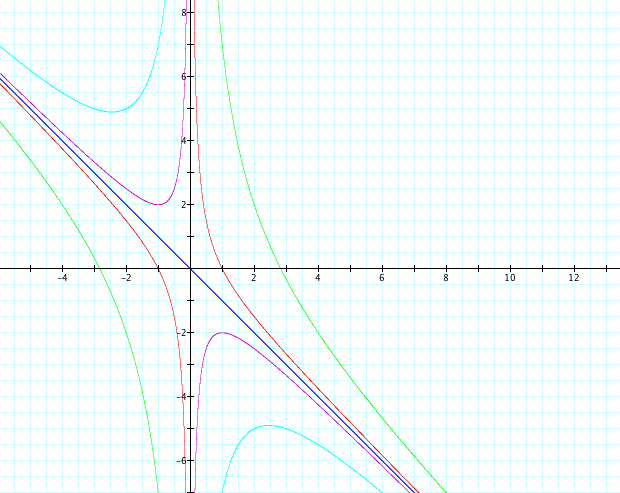
When I graph other values of c on the same axes, the graph becomes this
![]()
![]()
![]()
![]()
![]()
When c = 0 (as blue graph is represented), it becomes a straight line going through the origin. When c > 0, the graphs looks like tilted parabolas (represented by purple and light blue graphs) and when c < 0, the graphs look like hyperbolas (represented by green and red graphs).
Using the same equations, I added y = n as n varies from -5 to 5.
When c > 0, y = n intersects with the equation on: 1) two points 2) 1 point or 3) no points. It means depending on the n value, there are 1, 2, or no solutions of x^2 + yx + c = 0.
When c < 0, y = n intersects with the equation always on two points. It means that there are always 2 solutions of x^2 + yx + c = 0.
When c = 0, y = x intersects with the equation on 1 point only all the time.
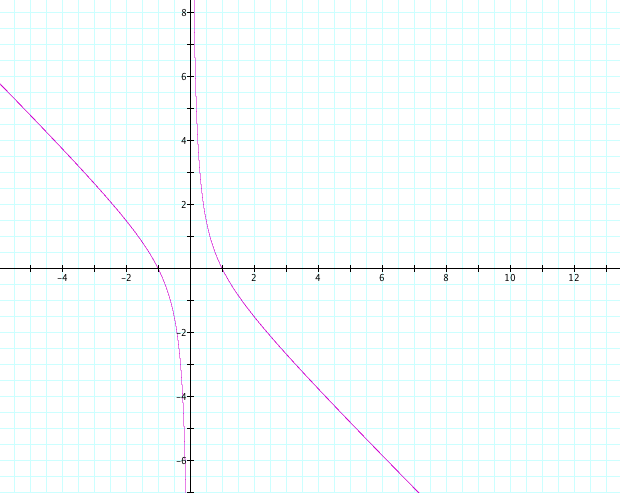
I add the graph of 2x + y = 0 to the original equation.
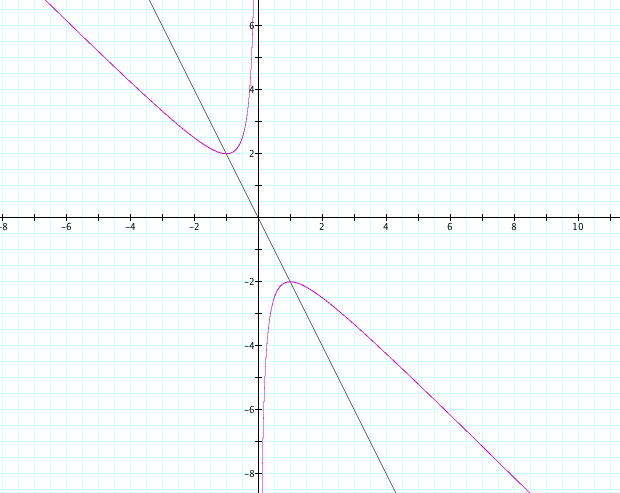
It appears that there are two intersections between two graphs: (-1, 2) and (1, -2)
Let's do the work algebraically.